大家好,我是磊哥。
最近客戶有個新需求,就是想檢視網站的存取情況,由於網站沒有做google的統計和百度的統計,所以存取情況,只能透過日誌檢視,透過指令碼的形式給客戶匯出也不太實際,給客戶寫個簡單的頁面,咱也做不到
成熟的日誌解決方案,那就是ELK,還有現在比較火的Loki,(當然還有很多其他解決方案,比如Splunk、Datadog等),那我們這個小網站,小體量,必然是選擇Loki來做
所以這次就采用
Nginx+Promtail+Loki+Grafana
來做一個簡單的Nginx日誌展示

Nginx的安裝不多說,Promtail和Loki都選用二進制的方式進行安裝,直接下載對應版本的二進制檔,解壓後指定配置檔啟動即可 ,
其中promtail配置檔如下配置:
server:
 http_listen_port: 9080
 grpc_listen_port: 0
positions:
 filename: /tmp/positions.yaml
clients:
 - url: http://localhost:3100/loki/api/v1/push
scrape_configs:
- job_name: nginx
 pipeline_stages:
 - replace:
 expression: '(?:[0-9]{1,3}\.){3}([0-9]{1,3})'
 replace: '***'
 static_configs:
 - targets:
 - localhost
 labels:
 job: nginx_access_log
 host: expatsxxxxs
 agent: promtail
 __path__: /var/log/nginx/expatshxxxxs.access.log
日誌收集工作完成後,在Nginx中,需要修改日誌格式,修改Nginx的日誌格式為Json格式,配置如下:
log_format json_analytics escape=json '{'
'"msec": "$msec", ' # request unixtime in seconds with a milliseconds resolution
'"connection": "$connection", ' # connection serial number
'"connection_requests": "$connection_requests", ' # number of requests made in connection
'"pid": "$pid", ' # process pid
'"request_id": "$request_id", ' # the unique request id
'"request_length": "$request_length", ' # request length(including headers and body)
 '"remote_addr": "$remote_addr", ' # client IP
 '"remote_user": "$remote_user", ' # client HTTP username
 '"remote_port": "$remote_port", ' # client port
 '"time_local": "$time_local", '
 '"time_iso8601": "$time_iso8601", ' # local time in the ISO 8601 standard format
 '"request": "$request", ' # full path no arguments if the request
 '"request_uri": "$request_uri", ' # full path and arguments if the request
 '"args": "$args", ' # args
 '"status": "$status", ' # response status code
 '"body_bytes_sent": "$body_bytes_sent", ' # the number of body bytes exclude headers sent to a client
 '"bytes_sent": "$bytes_sent", ' # the number of bytes sent to a client
 '"http_referer": "$http_referer", ' # HTTP referer
 '"http_user_agent": "$http_user_agent", ' # user agent
 '"http_x_forwarded_for": "$http_x_forwarded_for", ' # http_x_forwarded_for
 '"http_host": "$http_host", ' # the request Host: header
 '"server_name": "$server_name", ' # the name of the vhost serving the request
 '"request_time": "$request_time", ' # request processing time in seconds with msec resolution
 '"upstream": "$upstream_addr", ' # upstream backend server for proxied requests
 '"upstream_connect_time": "$upstream_connect_time", ' # upstream handshake time incl. TLS
 '"upstream_header_time": "$upstream_header_time", ' # time spent receiving upstream headers
 '"upstream_response_time": "$upstream_response_time", ' # time spend receiving upstream body
 '"upstream_response_length": "$upstream_response_length", ' # upstream response length
 '"upstream_cache_status": "$upstream_cache_status", ' # cache HIT/MISS where applicable
 '"ssl_protocol": "$ssl_protocol", ' # TLS protocol
 '"ssl_cipher": "$ssl_cipher", ' # TLS cipher
 '"scheme": "$scheme", ' # http or https
 '"request_method": "$request_method", ' # request method
 '"server_protocol": "$server_protocol", ' # request protocol, like HTTP/1.1 or HTTP/2.0
 '"pipe": "$pipe", ' # "p" if request was pipelined, "." otherwise
 '"gzip_ratio": "$gzip_ratio", '
 '"http_cf_ray": "$http_cf_ray",'
 '"geoip_country_code": "$geoip_country_code"'
 '}';
配置檔中,需要註意的是geoip的配置,需要在nginx中添加geoip模組
首先透過yum安裝geoip及lib庫 ,
yum -y install GeoIP GeoIP-data GeoIP-devel
之後,重新編譯Nginx,透過
--with-http_geoip_module
添加nginx的geoip模組
編譯完成後,在objs目錄下生成新的Nginx可執行檔,替換原先的,透過
kill -USR2
訊號,升級Nginx
此時配置的
log_format
不會再報錯geoip指令找不到,配置完成後,配置網站的access日誌,參照剛才配置的json格式的
log_format
檢視此時的日誌格式
{"msec": "1633430998.322", "connection": "4", "connection_requests": "1", "pid": "29887", "request_id": "40770fec38c2e5a68714df5f7a67283d", "request_length": "392", "remote_addr": "106.19.96.55", "remote_user": "", "remote_port": "43746", "time_local": "05/Oct/2021:18:49:58 +0800", "time_iso8601": "2021-10-05T18:49:58+08:00", "request": "GET / HTTP/2.0", "request_uri": "/", "args": "", "status": "200", "body_bytes_sent": "60949", "bytes_sent": "61222", "http_referer": "https://cn.bing.com/search?q=expat+tourism+agent+in+china&go=Search&qs=n&form=QBRE&sp=-1&pq=expat+tourism+agent+in+chi&sc=0-26&sk=&cvid=8BD2D4B79B3A4FA682571CB5BC7334D4", "http_user_agent": "Mozilla/5.0 (iPhone; CPU iPhone OS 13_6 like Mac OS X) AppleWebKit/605.1.15 (KHTML, like Gecko) Version/13.1.2 Mobile/15E148 Safari/604.1", "http_x_forwarded_for": "", "http_host": "www.expatsholidays.com", "server_name": "www.expatsholidays.com", "request_time": "0.003", "upstream": "127.0.0.1:9000", "upstream_connect_time": "0.000", "upstream_header_time": "0.002", "upstream_response_time": "0.002", "upstream_response_length": "60991", "upstream_cache_status": "", "ssl_protocol": "TLSv1.2", "ssl_cipher": "ECDHE-RSA-AES128-GCM-SHA256", "scheme": "https", "request_method": "GET", "server_protocol": "HTTP/2.0", "pipe": ".", "gzip_ratio": "", "http_cf_ray": "","geoip_country_code": ""}
{"msec": "1633430998.709", "connection": "4", "connection_requests": "2", "pid": "29887", "request_id": "430fd53a457ea580c47e9b055da2b4d0", "request_length": "56", "remote_addr": "106.19.96.55", "remote_user": "", "remote_port": "43746", "time_local": "05/Oct/2021:18:49:58 +0800", "time_iso8601": "2021-10-05T18:49:58+08:00", "request": "GET /maps/api/js?ver=5.6.1 HTTP/2.0", "request_uri": "/maps/api/js?ver=5.6.1", "args": "ver=5.6.1", "status": "200", "body_bytes_sent": "41262", "bytes_sent": "41406", "http_referer": "https://www.expatsholidays.com/", "http_user_agent": "Mozilla/5.0 (iPhone; CPU iPhone OS 13_6 like Mac OS X) AppleWebKit/605.1.15 (KHTML, like Gecko) Version/13.1.2 Mobile/15E148 Safari/604.1", "http_x_forwarded_for": "", "http_host": "www.expatsholidays.com", "server_name": "www.expatsholidays.com", "request_time": "0.000", "upstream": "", "upstream_connect_time": "", "upstream_header_time": "", "upstream_response_time": "", "upstream_response_length": "", "upstream_cache_status": "", "ssl_protocol": "TLSv1.2", "ssl_cipher": "ECDHE-RSA-AES128-GCM-SHA256", "scheme": "https", "request_method": "GET", "server_protocol": "HTTP/2.0", "pipe": ".", "gzip_ratio": "3.06", "http_cf_ray": "","geoip_country_code": ""}
已經轉為JSON格式,接著安裝grafana,最快捷的方式,透過docker直接起一個
docker run -d -p 3000:3000 grafana/grafana
啟動後,透過admin/admin預設使用者名稱密碼登入,登陸後提示重設密碼,之後進入grafana界面
我們直接添加資料來源loki
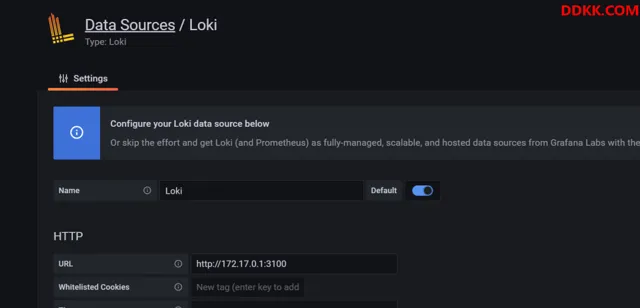
先透過explore查詢,日誌是否存入loki
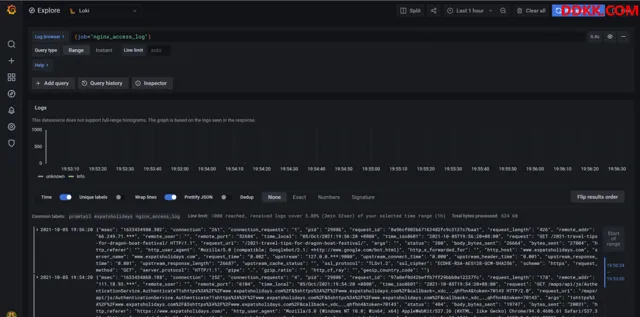
可以看到,日誌已經存入loki
接著添加Dashboard,透過ID匯入
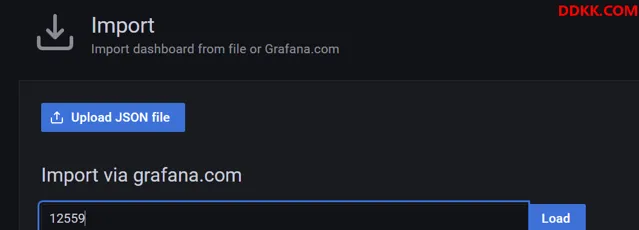
匯入如下
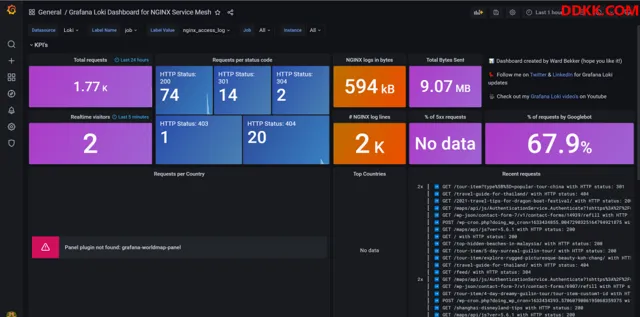
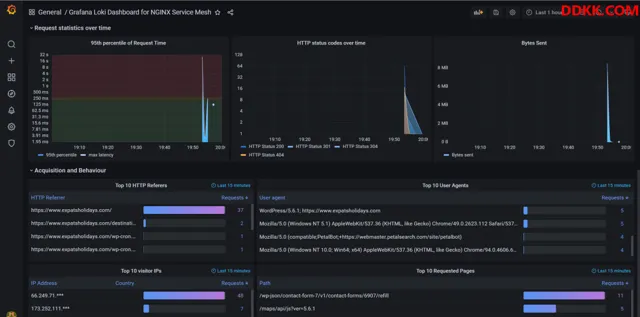
可以看到,這裏地圖沒展示,缺少
grafana-worldmap-panel
外掛程式,我們裝一下,透過命令列
grafana-cli plugins install grafana-worldmap-panel
安裝完成後,重新開機grafana,重新檢視dashboard
地圖可以展示,這裏因為地圖的地址是國外的地址,所以地圖的圖片無法載入,可以透過反代的方式解決
ok,今天內容就這些,透過簡單快速的方式,為客戶呈現網站的詳細存取情況,Loki+Grafana是絕佳的組合
🔥 磊哥私藏精品 熱門推薦 🔥


